


Getting started with Google Search Console involves three core activities: verifying you own your website, giving Google a map of your pages (your sitemap), and then regularly checking the reports to see what’s working and what isn’t.
Your GSC Starting Point for Business Growth
Google Search Console (GSC) is a free tool from Google that acts as a health check for your website and is one of the first tools we implement as a Leicester-based SEO agency. Think of it as a direct line of communication with Google, giving you information on how they see your site and where you appear in search results.
For any business owner, this isn’t just another piece of software. It provides valuable business intelligence, helping you stop guessing what customers want and start making decisions based on data. Used correctly, it can uncover new opportunities and help you fix problems before they cost you money.
Why GSC is an Essential Tool
Making a habit of checking GSC is fundamental to growing your business online. It brings clarity to the often-complex world of SEO.
- See Your Actual Search Traffic: Pinpoint the exact phrases customers are using on Google to find you. You’ll see which of your pages are most popular and where you’re ranking.
- Monitor Your Site’s Health: Get alerts for technical issues, like broken links (404 errors) or other problems that stop Google from properly viewing your site.
- Improve Your Pages: Discover which content is performing well and which could be improved to bring in more visitors.
GSC answers a critical question for any business website: “Are the right people finding us?” It’s your window into what’s working and what isn’t, directly from the source.
You’ll be looking at different numbers in GSC, so it helps to understand the main ones early on.
Key GSC Metrics at a Glance
| Metric | What It Measures | Why It Matters for a Business |
|---|---|---|
| Impressions | The number of times any URL from your site appeared in search results. | This is your brand’s visibility. High impressions mean you’re visible, even if clicks are low. |
| Clicks | The number of times a user clicked through to your site from a search result. | This is what drives traffic. It tells you if your page titles and descriptions are effective. |
| Average CTR | The percentage of impressions that resulted in a click (Clicks ÷ Impressions). | A low CTR might mean your messaging isn’t resonating, even if you’re ranking well. |
| Average Position | Your average ranking for a specific query or page over a time period. | This shows where you stand against competitors. A lower number (e.g., 3) is better than a higher one (e.g., 25). |
Understanding these terms will make navigating the reports easier. If you come across any other unfamiliar language, our complete SEO glossary is a useful resource.
It’s also worth noting how Google calculates things. For instance, if your page ranks at position 3 sometimes and 5 other times for the same search, GSC now does a better job of showing the highest position you achieved. This tweak gives you a clearer picture of your visibility. For a deep dive into how Google works this out, check out this in-depth GSC guide.
For most small businesses, exporting the standard 1,000 rows of data from any report is more than enough. If you’re running a larger e-commerce site with thousands of pages, you might eventually need to use the GSC API to pull all your data.
Now, let’s get you set up with Google Search Console. Before you can look at any data, you first need to prove to Google that you own your website.
This first step is about verification. When you add your site, Google gives you two main ways to do this: as a Domain property or as a URL prefix. The one you choose matters, as it changes the scope of the data you’ll see.
The goal isn’t just to look at charts; it’s about turning that data into insights that help you grow.
Domain Property vs. URL Prefix: Which One to Choose?
For almost everyone, the Domain property option is the best choice. It’s a catch-all method that groups every version of your website into a single profile. This means it tracks http, https, www, and non-www versions together. So, whether someone finds you via https://yourshop.co.uk or http://www.yourshop.co.uk, the data all goes to the same place.
To use this method, you’ll need to add a small record to your domain’s DNS settings. This might sound technical, but it’s usually a case of copying a line of text from Google and pasting it into a field at your domain registrar (like GoDaddy, Namecheap, or 123 Reg).
The URL prefix method is more specific. It only tracks the exact address you enter. If you verify https://yourshop.co.uk, you won’t see any data for the http:// version or any subdomains. It has its uses for specific tracking scenarios, but for a complete picture of your site’s health, it’s limited.
We almost always recommend the Domain property method. It simplifies things by putting all your data in one place, so you get a true, complete view without missing anything.
Once you’ve verified your site, your next job is to hand Google a map.
Submitting Your Sitemap
With verification sorted, it’s time to submit your XML sitemap. A sitemap is a roadmap of your website, listing all the important pages you want Google to find and index. Without one, Google’s crawlers have to find everything on their own, and they might miss a new blog post or an important product page.
Most modern platforms, like Shopify, WooCommerce, or WordPress using an SEO plugin like Yoast, generate this file for you automatically. You’ll typically find it at a URL like yourwebsite.co.uk/sitemap.xml.
Submitting it is straightforward:
- In Search Console, find ‘Sitemaps’ in the menu on the left.
- Enter your sitemap URL into the ‘Add a new sitemap’ box.
- Click ‘Submit’.
Google will then start processing it. You might see a ‘Couldn’t fetch’ status at first, but this usually updates to ‘Success’ after a short while. Give it a few hours, or even a day. Once you see the ‘Success’ message, you’ve given Google a clear guide to your site’s structure.
Finding Actionable Insights in the Performance Report
Once you’re verified and your sitemap is submitted, the Performance report is where you’ll spend most of your time in Google Search Console. Think of it as a guide showing you what to do next to get more traffic.
The report is built around four key metrics: Clicks, Impressions, Click-Through Rate (CTR), and Average Position. The trick is to see how they work together. For example, getting lots of impressions but few clicks is a common sign that people are seeing you in the results, but your page title or description isn’t compelling enough for them to click.
Understanding the Core Metrics
The large graph at the top tracks your chosen metrics over time—you can change the date range as needed. Below that, you’ll find a set of tabs: Queries, Pages, Countries, Devices, Search appearance, and Dates. This is how you start digging into the details.
- Queries: These are the exact search terms people are using on Google to find you. This is a valuable source for understanding what your customers are looking for.
- Pages: This shows you which pages on your site are bringing in the most traffic from search.
- Devices: A quick way to see how your site performs on desktop versus mobile or tablet. Poor mobile performance here is a clear sign that your mobile site needs attention.
The real value comes when you start combining these filters. Click on a specific page, and GSC will show you all the queries that bring people to it. Or, click on a query to see which of your pages ranks for it. This is how you move from looking at data to building a to-do list.
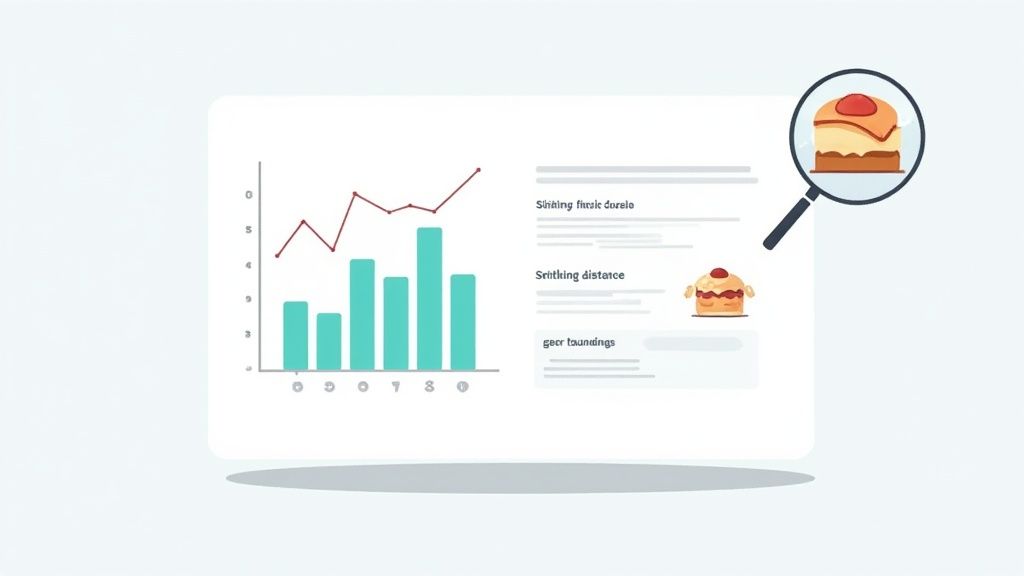
Spotting Your ‘Striking Distance’ Keywords
One of the most effective things a business can do is look for ‘striking distance’ keywords. These are terms where you’re ranking on page two of Google, typically in positions 11 to 20. With a little effort, you can often push these onto page one, where click volume increases significantly.
It’s easy to find them. Go to the ‘Queries’ tab and filter the ‘Position’ column to show rankings greater than 10. You’re looking for relevant terms that already get a decent number of impressions. A local restaurant in Leicester, for instance, might see they’re ranking at position 12 for “best Sunday lunch in Leicestershire.”
Once you’ve found a target keyword and the page it ranks for, you have a clear action plan:
- Improve the content on that page. Can you add more detail, answer more questions, or include better photos?
- Adjust the page title and meta description to make them more compelling and relevant to the search term.
- Add a few internal links to that page from other important pages on your website.
A small effort for a page-two keyword can deliver a much bigger return, much faster, than trying to rank for a new, highly competitive term from scratch. It’s about picking the right battles.
Uncovering Hidden Content Ideas
The Performance report is also useful for finding out what your audience is interested in, which isn’t always what you think. The data can reveal surprising gaps in your content.
For example, a local bakery might notice they’re getting impressions for “vegan birthday cakes near me,” even though they don’t have a specific page about it. That’s a direct signal from potential customers telling you what they want. It’s the perfect prompt to create a new page or a blog post about your vegan cake options.
Keeping an eye on your performance is also vital for understanding Google’s own changes. You might remember the confusion in September 2025 when many businesses saw a sudden drop in GSC impressions. It turned out to be a technical change from Google to make impression counts more accurate. Businesses that were actively monitoring their GSC data were able to understand what was happening and avoid making hasty decisions. You can read a breakdown of this Google update and its impact on Found.co.uk.
Ultimately, this report bridges the gap between what Google sees and what your customers do. GSC tells you how they find you, but to understand what they do after they click, you need a tool like Google Analytics 4. To get started, check out our guide on mastering GA4 with these practical tips. Using both tools together gives you the complete picture of your customer’s journey.
Using the Coverage Report to Maintain Website Health
While the Performance report tells you how people find you, the Coverage report reveals what Google itself can find. It acts as a technical health check for your website, showing which of your pages are successfully indexed and flagging any that Google is struggling with.
Ignoring this report can lead to small indexing issues becoming major problems that affect your rankings.
The report groups all your website’s pages into four main categories: Error, Valid with warnings, Valid, and Excluded. Your plan should be to tackle the ‘Error’ list first, then review the other categories to make sure everything is as you expect.
Understanding the Four Key Statuses
Each status tells a different story about your pages. Understanding what they mean is the first step toward taking the right action.
- Error: This is your priority list. These are pages that Google tried to index but couldn’t because of a serious problem. They won’t appear in search results.
- Valid with warnings: These pages are on Google, but it has spotted an issue you should investigate. They’re showing up in search, but they might not be performing as well as they could.
- Valid: This is the good news. These are all the pages that Google has successfully indexed.
- Excluded: These are pages Google has decided not to index. This is often deliberate on your part and isn’t necessarily a bad thing.
The goal isn’t to have zero ‘Excluded’ pages. It’s to have zero pages under ‘Error’ and to understand why pages are in the other categories. Context is important here.
Let’s look at how to handle the common issues you’ll find in each section.
Tackling Critical Indexing Errors
The ‘Error’ tab is where you need to be proactive. Clicking into it reveals a list of specific error types affecting your pages. Most of these issues boil down to a few common problems that are often straightforward to fix.
A common one is the ‘Submitted URL not found (404)’ error. This means a page you listed in your sitemap doesn’t exist anymore. Perhaps you deleted an old product or service page. The fix is to remove that URL from your sitemap file and resubmit it.
Another frequent issue is a ‘Server error (5xx)’. This points to a problem with your website’s hosting. If you see a sudden spike in these, it’s time to contact your hosting provider to see if they’re having technical difficulties. Fixing these errors ensures Google can access your content.
What to Do About Warnings and Excluded Pages
The ‘Valid with warnings’ and ‘Excluded’ lists require a bit more interpretation. A page might be valid but have a warning because it’s being blocked by your robots.txt file. You just need to check if that block is intentional (like for an admin login page) or an accident.
The ‘Excluded’ list is often the largest. You’ll see things like ‘Page with redirect’ or ‘Crawled – currently not indexed’. A redirect is perfectly fine if you’ve intentionally updated a URL.
You might also spot an ‘Alternate page with proper canonical tag’. This is Google’s way of saying it found a duplicate of a page but correctly identified the main version you want it to index. Our guide on handling the “alternate page with proper canonical tag” issue breaks this down in more detail.
Most importantly, you’ll see pages you’ve deliberately blocked with a ‘noindex’ tag, like a ‘thank you’ page customers see after filling out a form. Seeing these in the ‘Excluded’ list is a good sign—it confirms you’ve set it up correctly.
To make things clearer, here’s a quick reference table to help you decide on your next steps for any status you see.
Common Coverage Statuses and Your Next Steps
| Status Type | What It Means | Action for a Business Owner |
|---|---|---|
| Error | Google could not index the page due to a significant issue (e.g., it doesn’t exist or the server failed). | Immediate Action: Investigate the specific error type. Fix the underlying problem (e.g., restore a deleted page, remove it from your sitemap, or contact your host) and then click ‘Validate Fix’ in GSC. |
| Valid with warnings | The page is indexed, but there’s a non-critical issue that might affect its performance. | Review: Look at the warning. Is a page blocked by robots.txt that shouldn’t be? Decide if a change is needed. |
| Valid | The page has been successfully indexed by Google with no problems. | No Action Required: This is what you want to see for all your important pages. |
| Excluded | Google has chosen not to index this page, often for a valid and intentional reason. | Check and Confirm: Quickly review the reason. If it’s a ‘noindexed’ thank you page or a redirected old URL, that’s fine. If an important page is here under ‘Crawled – currently not indexed’, you may need to improve its content or internal linking. |
By regularly checking the Coverage report, you can stay on top of your site’s technical health. This ensures every important page has the best possible chance of being found by your customers on Google.
Making the Most of Enhancements and Links
Once you’ve grasped the basics of traffic tracking and error fixing, it’s time to look at the reports that can give you a competitive edge. Google Search Console’s Enhancements and Links reports offer a deeper look into your site’s special features and how it’s viewed by the rest of the web.
Understanding these reports is how you move from just maintaining your site to actively growing it.

These reports aren’t just about technical health. They’re about enriching how you appear in search results and understanding your site’s reputation, both of which are critical for long-term success.
Using Enhancements to Improve Your Search Results
The Enhancements section is about your structured data. This is a specific type of code you add to your pages that gives Google extra context about your content. If you get it right, Google may reward you with ‘rich results’ – those more noticeable listings with star ratings, prices, or FAQ dropdowns.
For a local business, this is very useful. For example, a plumber in Leicester might have added ‘Local Business’ structured data to their site. The Enhancements report is where you’ll see if Google can properly read your opening hours, service area, and customer reviews. If something is wrong, Google flags it here, so you can fix it and improve your chances of showing up in local searches.
It’s the same for an e-commerce store on Shopify or WooCommerce. You’ll be using ‘Product’ schema to feed Google information like price, stock levels, and review scores.
- See what’s working: The report shows you how many of your product pages have valid structured data.
- Pinpoint what’s broken: It will also flag any errors, like a missing price field or an invalid review format, that are stopping you from getting rich results.
Think of the Enhancements report as your quality control centre for your most valuable search features. A ‘Valid’ status here means you’re giving yourself the best possible chance of grabbing a searcher’s attention.
Understanding Your Site’s Authority with the Links Report
The Links report is divided into two parts: external links (other websites linking to you) and internal links (how you link between your own pages). Both tell an important story about your website’s SEO health.
Who’s Linking to You? (External Links)
External links, often called backlinks, are a strong signal to Google about your site’s authority and trustworthiness. This report shows you exactly which websites are linking to you and which of your pages they’re linking to most often.
This is powerful information. If a well-regarded local business directory or an industry blog links to your homepage, that’s a vote of confidence in Google’s eyes. By checking your Top linking sites, you can see who your biggest supporters are. It might even spark some ideas – perhaps you can strengthen a relationship with a site that’s already linked to you.
Are You Linking to Your Most Important Pages? (Internal Links)
While external links build your overall authority, internal links are how you spread that authority around your own site. They guide users and Google to your most important content. The ‘Top linked pages’ section under ‘Internal links’ shows you which pages are getting the most internal links.
Your homepage will almost always be at the top of this list. But you should also see your key service pages or top product categories high on the list. If a crucial page has hardly any internal links pointing to it, you’re sending a signal to Google that you don’t think it’s very important.
For instance, a hotel in Market Harborough might check this report and find its “Wedding Venue Hire” page has only two internal links. This is a missed opportunity. By adding links to this page from their blog, homepage, and gallery, they signal its importance to Google, helping it rank better. A solid internal linking strategy is one of the most effective SEO tactics you can control, and this report gives you the blueprint to get it right.
Common Questions About Google Search Console
Even after you’ve understood the main reports, a few questions often come up. We get them from business owners just getting started with Google Search Console. Let’s run through the most common ones.
Our aim is to clear up any confusion so you can use the tool with confidence.
How Is Search Console Different From Google Analytics?
This is the number one question we’re asked. The easiest way to explain it is this: Search Console tells you what happens before someone visits your site, while Google Analytics tells you what happens after they arrive.
- Google Search Console is about your performance in Google’s search results. It shows you the search terms people used to find you, how many people saw your site in the results, how many clicked, and if Google is having any trouble viewing your pages. It’s your window into your organic search visibility.
- Google Analytics takes over once a visitor is on your website. It tracks how they got there (from Google, social media, an email link), what pages they looked at, how long they stayed, and if they completed an action, like buying something or filling out a contact form.
You need both to get the full picture. Search Console helps you get more visitors, and Analytics tells you what they do once they’re on your site.
How Often Should I Check My GSC Reports?
You don’t need to check Search Console every day. For most small businesses, it’s about finding a practical rhythm.
We usually recommend a quick weekly check-in. A five-minute look at your Performance report is enough to make sure there are no major drops in clicks or impressions. Then, once a month, set aside more time for a monthly review. This is when you can look into the Coverage report for errors, find new content ideas in your top queries, and see if you need to improve your internal links.
For any SME, checking GSC once a month is a good starting point. It’s often enough to spot problems early, but not so frequent that you get lost in normal day-to-day data fluctuations.
What Should I Do If My Data Suddenly Drops?
Seeing a sudden, steep drop in your clicks or impressions can be worrying. The key is not to panic. Your first job is to investigate, not to rush into making big changes to your website.
First, check the dates of the drop. Does it line up with a major Google algorithm update? Or could it be a technical issue? The Coverage report is your best friend here – check for a spike in server errors (the ‘5xx’ ones), which could mean your site was temporarily offline.
Sometimes, what looks like a drop isn’t a drop in performance at all. As we mentioned earlier, Google sometimes updates how it calculates or reports data, which can cause sudden shifts in your charts. Always look for the context behind the numbers before concluding there’s a problem.
Google Search Console is most powerful when the data it surfaces is acted on systematically — knowing a page has high impressions but a low click-through rate is only useful if you know what to do next. If you’d like that data interpreted and acted on as part of an ongoing partnership, our SEO services that include regular Search Console analysis and reporting are included as standard in every engagement.